Profile the result of MHM/CMP, ie obtain, summarize and visualize
results for each window size.
Usage
ms_profile_df(x)

ms_profile(
  x,
  summary_fun = mean,
  error_fun = se,
  title = "multiscale profile",
  ylab = "mean +/- SE"
)
Arguments
- x
SpatRast typically obtained from MHM/CMP
- summary_fun
a function to calculate a
summary statistic for each window (default to mean)
- error_fun
a function to calculate an
error statistic for each window (default to standard error)
- title
for the plot
- ylab
for the y axis
Value
a plot or a data.frame
Examples
landscape <- import_example("l1.tif") %>%
raster_resample(0.2)
# vanilla MHM
res <- MHM(landscape, window=c(3, 5, 7, 9, 13, 17, 33))
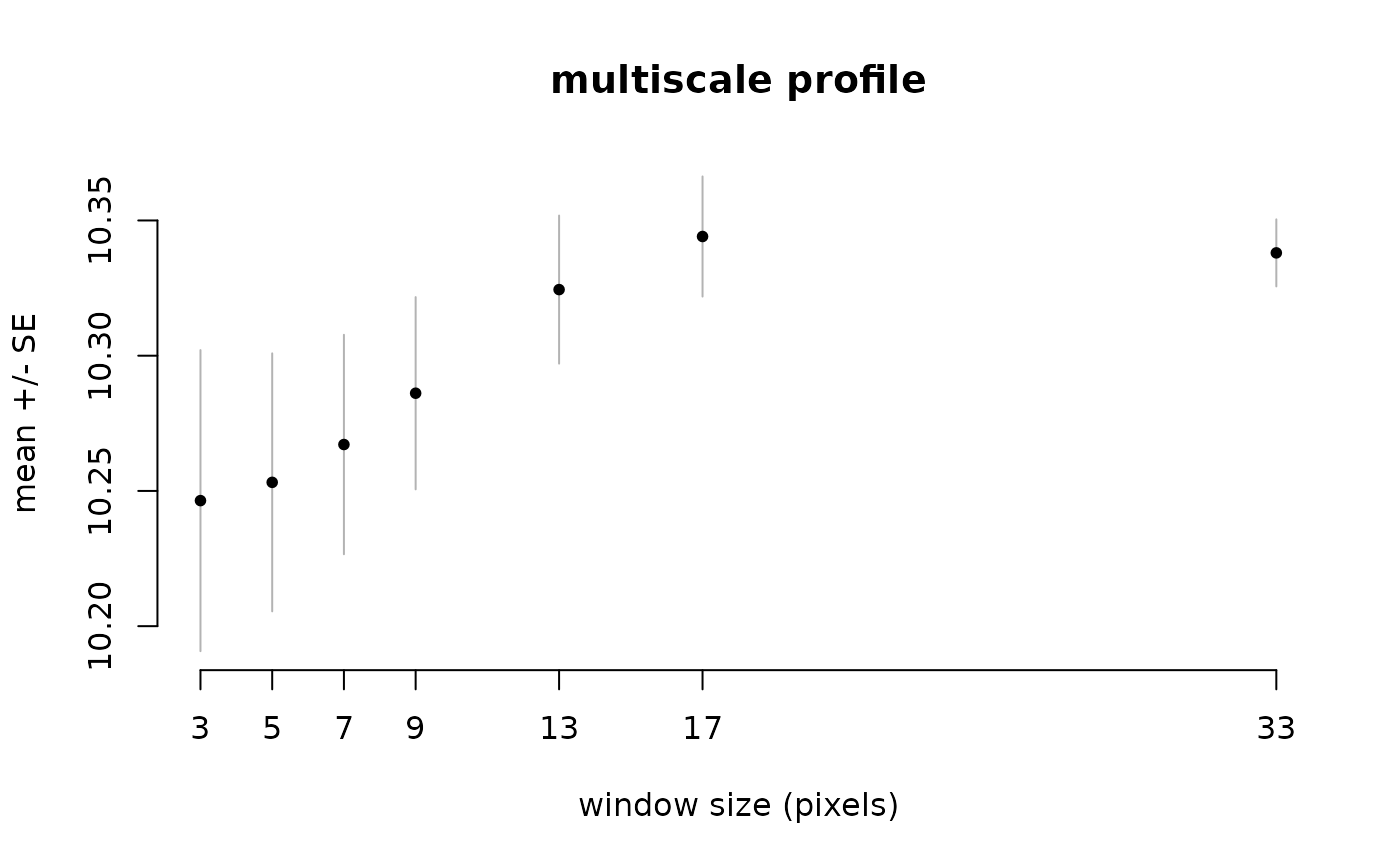
# plot the ms_profile plot directly
res %>% ms_profile()
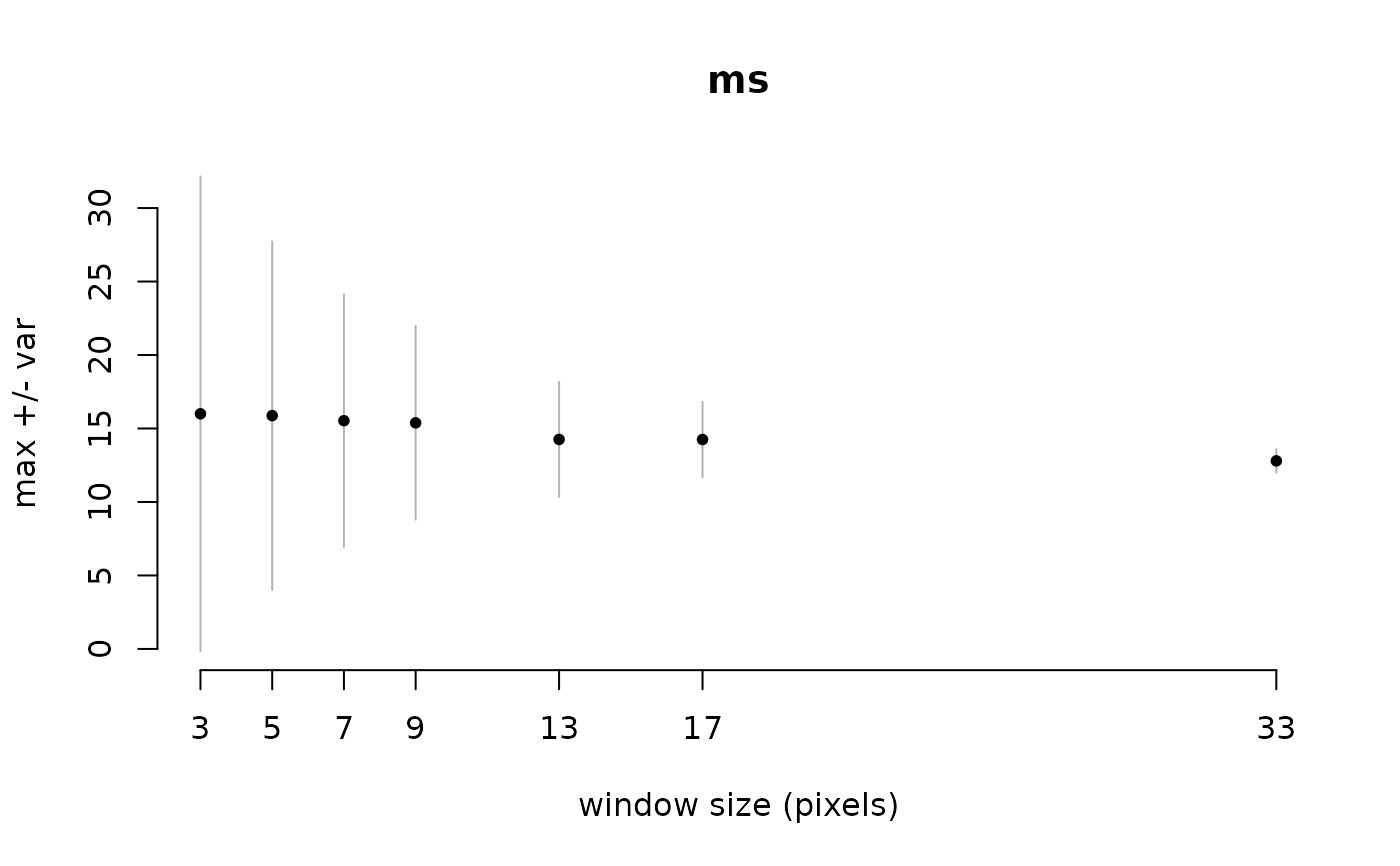
 # you can tweak summary_fun, error_fun and title
res %>% ms_profile(summary_fun=max, error_fun=var, ylab="max +/- var", title="ms")
# you can tweak summary_fun, error_fun and title
res %>% ms_profile(summary_fun=max, error_fun=var, ylab="max +/- var", title="ms")
 # you can also get the raw data.frame
# to make your own (eg ggplot2) graph
res %>% ms_profile_df() %>% head()
#> window value
#> 1 3 1.000000
#> 2 3 1.000000
#> 3 3 3.750000
#> 4 3 3.750000
#> 5 3 3.750000
#> 6 3 4.666667
# you can also get the raw data.frame
# to make your own (eg ggplot2) graph
res %>% ms_profile_df() %>% head()
#> window value
#> 1 3 1.000000
#> 2 3 1.000000
#> 3 3 3.750000
#> 4 3 3.750000
#> 5 3 3.750000
#> 6 3 4.666667